Since March of 2020, Healthgrades has tracked patient confidence as it relates to medical and everyday activities. Healthgrades was interested in understanding whether patients were still comfortable visiting their doctor, in spite of the uncertainty of the global pandemic. The answer for the past two years has been and continues to be yes–with increasing rates of consumer confidence.
Overall confidence in medical and non-medical related activities is at its highest point since March 2020. Medical-related comfort is at a high of 81%, up from 77% in February 2022, and overall comfort is above 76%. Despite the ongoing nature of Omicron, patient confidence has significantly recovered from the Omicron variant affecting overall activity after the holidays.
Throughout the two years that this survey has run, Healthgrades–in partnership with Infosurv–has measured topics such as healthcare worker sentiment, having children return to school, surges in telehealth usage, vaccine sentiment, and patients’ thoughts about hospital quality. This past month the Healthgrades COVID-19 Patient Confidence Survey explored employee sentiment as it pertains to going back to the office.
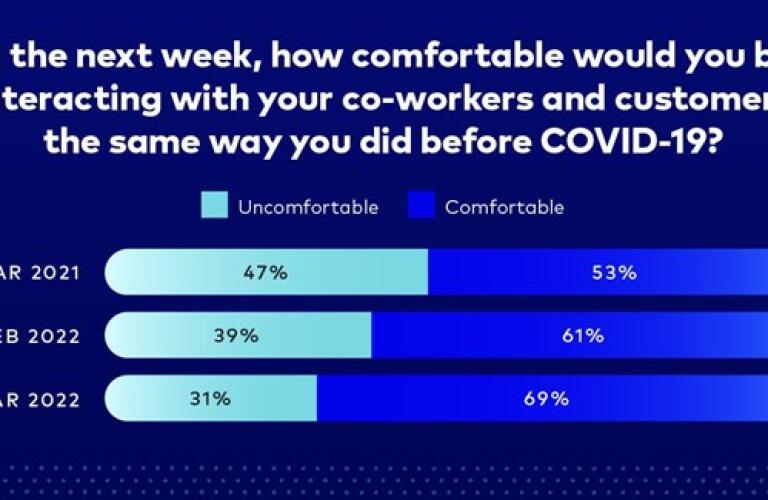
Comfort in returning to pre-COVID interactions at work has increased significantly
In March 2022, survey respondents were asked: “In the next week, how comfortable would you be interacting with your co-workers and customers the same way you did before COVID-19?” 69% of respondents claimed that they would be comfortable or somewhat comfortable. This response is up from the 53% comfort level reported in March 2021. Of the group that was comfortable, white males claimed to be the most comfortable returning to pre-COVID interactions at 74%. Individuals making $75K or more annually were more comfortable than individuals making under $75K annually.
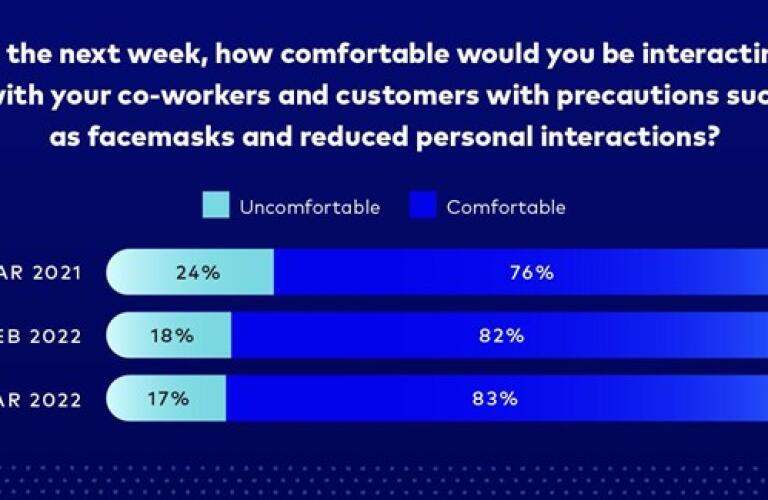
More than 4 in 5 people remain comfortable interacting at work when precautions are in place. When asked, “In the next week, how comfortable would you be interacting with your co-workers and customers with precautions such as facemasks and reduced personal interaction?” 83% of respondents stated that they were comfortable.
Most people know someone diagnosed with COVID-19
Two-thirds of respondents know someone who has been diagnosed with COVID-19. This number is significantly higher than it was a year ago, when only 56% of those surveyed reported having a friend or family member who had been diagnosed with COVID-19, but has dipped slightly since January’s survey, when 72% of respondents reported knowing someone who had been diagnosed.
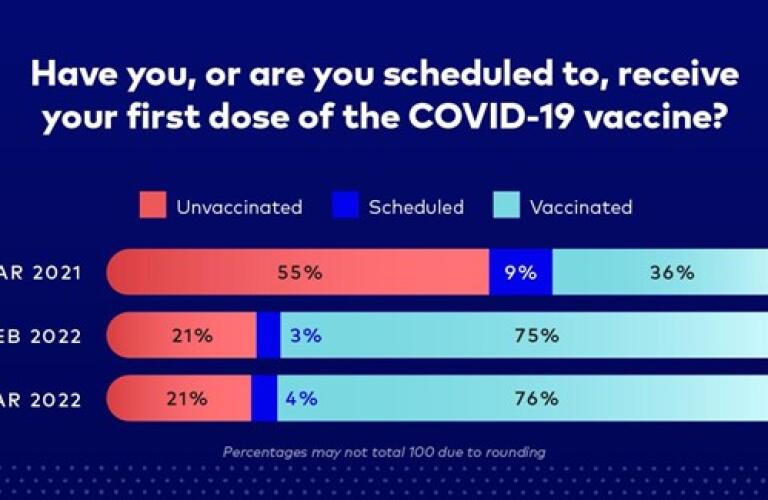
Vaccination levels remain consistent with last month
Three-quarters of Americans have received or are scheduled to receive the first dose of the COVID-19 vaccine, which is inline with CDC vaccination counts. Low-income, younger, and African Americans remain the demographic groups most likely to be unvaccinated. Conservative Americans are also less likely to be vaccinated than Liberal Americans, but this finding is only true at the 90% confidence level due to low sample size among Conservatives.
More than four in five respondents who have not been vaccinated plan to remain unvaccinated over the next month.
About this data
Since March 27, 2020, Healthgrades has been tracking consumer confidence towards essential and non-essential activities. As the weeks have gone by and the situation fluctuated, this study has offered key insights into the changing nature of consumer confidence and its impact on consumer behavior.
The study is conducted once per week in partnership with Infosurv and includes a random sample of N=200 Americans across multiple geographies, genders, and age ranges.
*The Comfort Index is calculated by averaging the top two box scores from each question for each wave or month. There are three indices shown on the graphs:
The Overall Comfort Index is the average of the results from all 14 questions listed below.
The Medical-Related Comfort Index is the average of the results from five medical-related comfort topics:
- Visiting a primary care provider
- Visiting an urgent care facility
- Visiting a medical specialist
- Visiting a hospital (added to the survey on June 4)
- Having an in-office medical procedure (started June 4)
The Everyday Comfort Index is the average of the results from nine questions about comfort engaging in everyday activities:
- Visiting a grocery store
- Dining inside a restaurant
- Seeing a movie at a theater
- Visiting a public gathering (concert, sporting event, etc.)
- Visiting a salon (started June 4)
- Traveling via plane (started June 4)
- Driving to a vacation spot (started June 4)
- Staying at a hotel (started June 4)
- Going to a theme park (started June 4)