Healthgrades continues to track trends in consumer confidence toward essential and non-essential activities. The most recent wave of survey data that ran on January 6, 2022, in the Healthgrades Consumer Patient Confidence Study has indicated that patients are certainly seeing the effects of the Omicron variant.
Before the Omicron wave hit in mid-December, comfort with everyday activities was previously holding steady week-over-week at approximately 70%. The week of December 23, 2021, this metric fell to 58%, which represents the lowest weekly measurement since August of 2021 and tracks with the monthly average of April 2021. In the most recent week, it has held steady at 59%. The survey data indicates that respondents are less comfortable with activities like visiting restaurants and theatres, traveling, and interacting with co-workers and customers the same way they did before COVID, but they remain more comfortable than the lows in 2020.
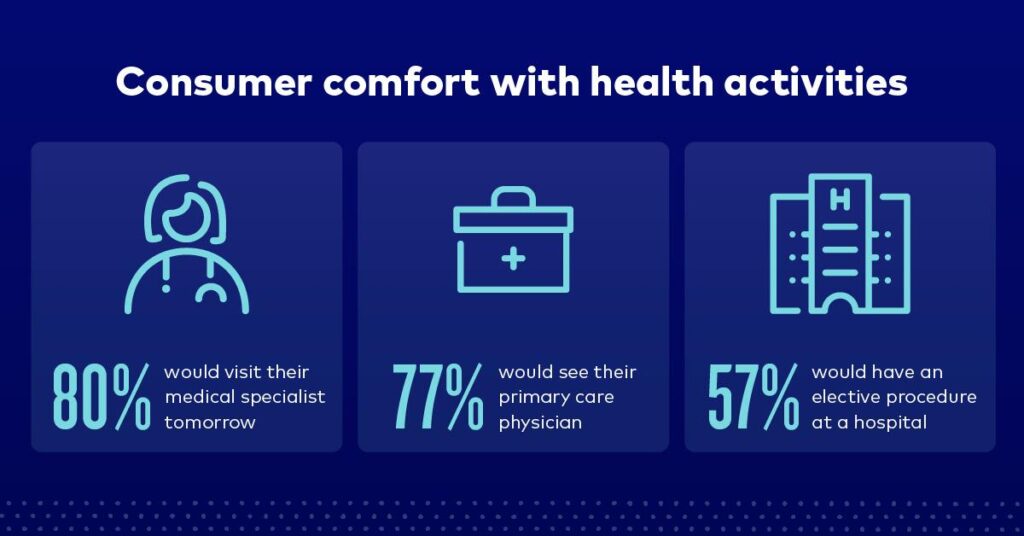
In addition to the declines in everyday activity comfort, medical-related comfort has seen a small decline as well. Medical-related comfort has dropped four points to 70%. Medical-related Comfort has seen a lot of fluctuation over the past few months. In December 2021, medical-related comfort moved from 78% of respondents being comfortable December 16, to 69% December 23, and back up to 74% on December 30. Respondents are slightly less comfortable visiting an HCP now than they were in early December but are still very comfortable. Despite these changes, it remains notably higher than the low of 40% comfort seen in April 2020.
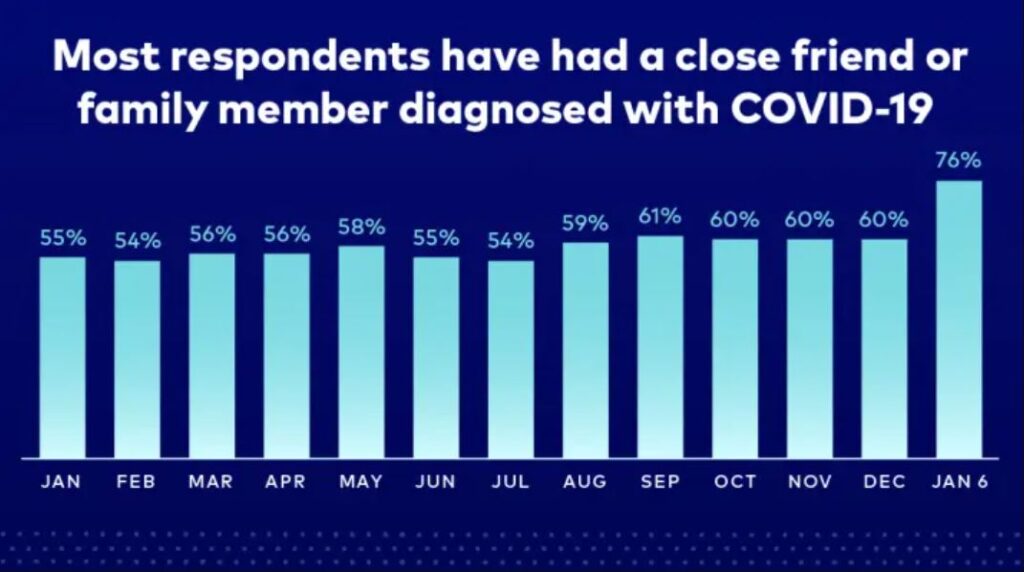
One of the most interesting insights that came from the January 6, 2022, survey is that 76% of respondents reported having a close friend or family member diagnosed with COVID-19 – a new highwater mark for the study and a full 15 points higher than on December 31.
In-office medical visits also appear to have declined in December with 22.2% of respondents reporting having ALL in-offices visits canceled, which was up from 18% of patients canceling in November.
Respondents’ concern about COVID impacting their/their family’s health is also on the rise. Over the last four weeks, we’ve seen a similar pattern as those observed in July/August when the Delta variant was on the rise. ~35% of respondents reported feeling “Very Concerned,” up from 31% in November. It’s worth noting that this metric was at a study low of 25% in June of 2021 before the Delta variant picked up. Over the first three months of Delta survey coverage, those reporting that they were “Very Concerned” increased 12 percentage points (37% in September) before declining in October and again in November. If a similar trend occurs with Omicron, we could see concern levels rise to near peak levels by February 2022.
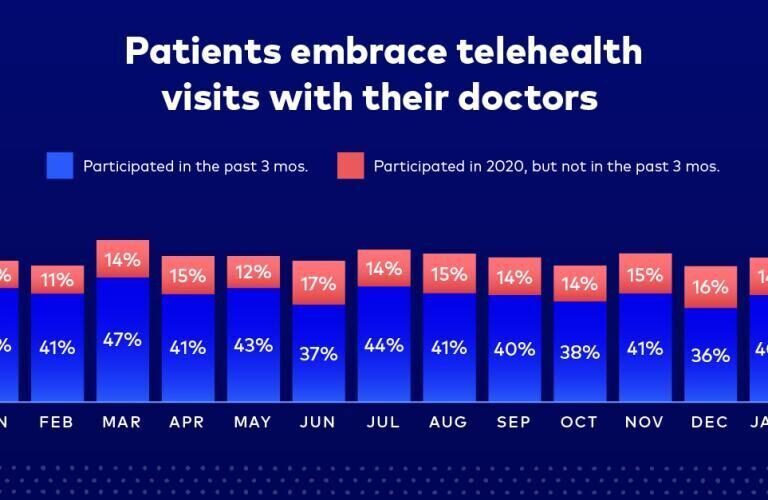
Somewhat surprisingly, reported telehealth usage continues to fall. Those reporting telehealth visits in the last three months peaked in March of 2021 (47% reporting usage) and fell to 36% for December 2021, the lowest monthly total since June 2020. With Omicron cases at an all-time high, telehealth usage has increased to 40%, but not as high as the peak in March of 2021.
Since a vaccine has been made available to Americans, the survey found that the majority (just over 76%) of respondents reported that they had received their vaccine or were scheduled to receive it. This stat is a three-point increase over November 2021. As for patients who do not intend to be vaccinated, that sentiment has grown stronger. Of respondents who are unvaccinated or unscheduled to get a vaccine, only 13% indicated in December 2021 that they are “Likely” to get the vaccine with 72% reporting they are “Very Unlikely.”
About this data
Since March 27, 2020, Healthgrades has been tracking consumer confidence towards essential and non-essential activities, like visiting a doctor. As the weeks have gone by and the situation fluctuated, this study has shown the ups and downs of consumer confidence and its impact on consumer behavior.
The study is conducted once per week in partnership with Infosurv and includes a random sample of N=200 Americans across multiple geographies, genders, and age ranges.
*The Comfort Index is calculated by averaging the top two box scores from each question for each wave or month. There are three indices shown on the graphs:
The Overall Comfort Index is the average of the results from all 14 questions listed below.
The Medical-Related Comfort Index is the average of the results from five medical-related comfort topics:
- Visiting a primary care provider
- Visiting an urgent care facility
- Visiting a medical specialist
- Visiting a hospital (added to the survey on June 4)
- Having an in-office medical procedure (started June 4)
The Everyday Comfort Index is the average of the results from nine questions about comfort engaging in everyday activities:
- Visiting a grocery store
- Dining inside a restaurant
- Seeing a movie at a theater
- Visiting a public gathering (concert, sporting event, etc.)
- Visiting a salon (started June 4)
- Traveling via plane (started June 4)
- Driving to a vacation spot (started June 4)
- Staying at a hotel (started June 4)
- Going to a theme park (started June 4)